Predicting the House Price Increase Rate
In this part, we desire to predict the increase rate by census tracts in philadelphia. We hope the prediction can help the different groups of people understanding the trend of the house price in specific area and help them making decision.
Data preprocessing
- First, we calculate the Price Increase Rate and Price Increase for every census tract.
test_sales_tract18['Price Increase rate'] = test_sales_tract18['sale_price_K']/test_sales_tract13['sale_price_K'] test_sales_tract18['Price Increase'] = test_sales_tract18['sale_price_K']-test_sales_tract13['sale_price_K'] - We collect the sales data of 2018 and select the feature columns we want to use.
# The feature columns we want to use cols = [ "sale_price", "total_livable_area", "total_area", "garage_spaces", "fireplaces", "number_of_bathrooms", "number_of_bedrooms", "number_stories", "exterior_condition", "zip_code", "geometry" ] - Use the spatial join to combine the sales data with tract data and add the columns Price Increase Rate and Price Increase for the sales data.
- Do the data cleaning,such as trim thr columns and remove NaNs, trim zip code to only the first five digits.
sales = salesRaw[cols].dropna()
sales['zip_code'] = sales['zip_code'].astype(str).str.slice(0, 5)
Feature Engineering
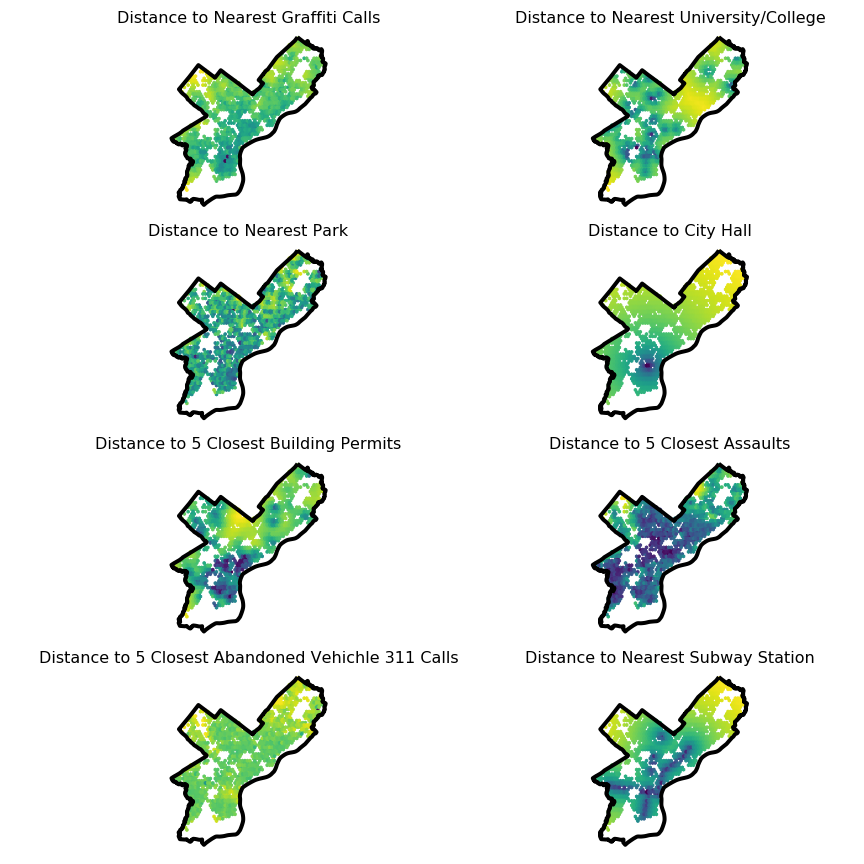
We want to improve our model by adding more variables in it. We create some features for our sales data. We use scikit learn’s nearest neighbor algorithm to calculate the distance from each sale to its nearest neighbor in the amenity/disamenity datasets.
For example:
- Distance to the nearest university/college
- Disrance to the nearest subway station
- Distance to the nearest Graffiti Call
- Distance to the nearest park centroid
- Distance to City Hall
- Distance to the 5 nearest new construction permits from 2018
- Distance to 5 Closest Assaults
- Distance to 5 Closest Abandoned Vehichle 311 Calls
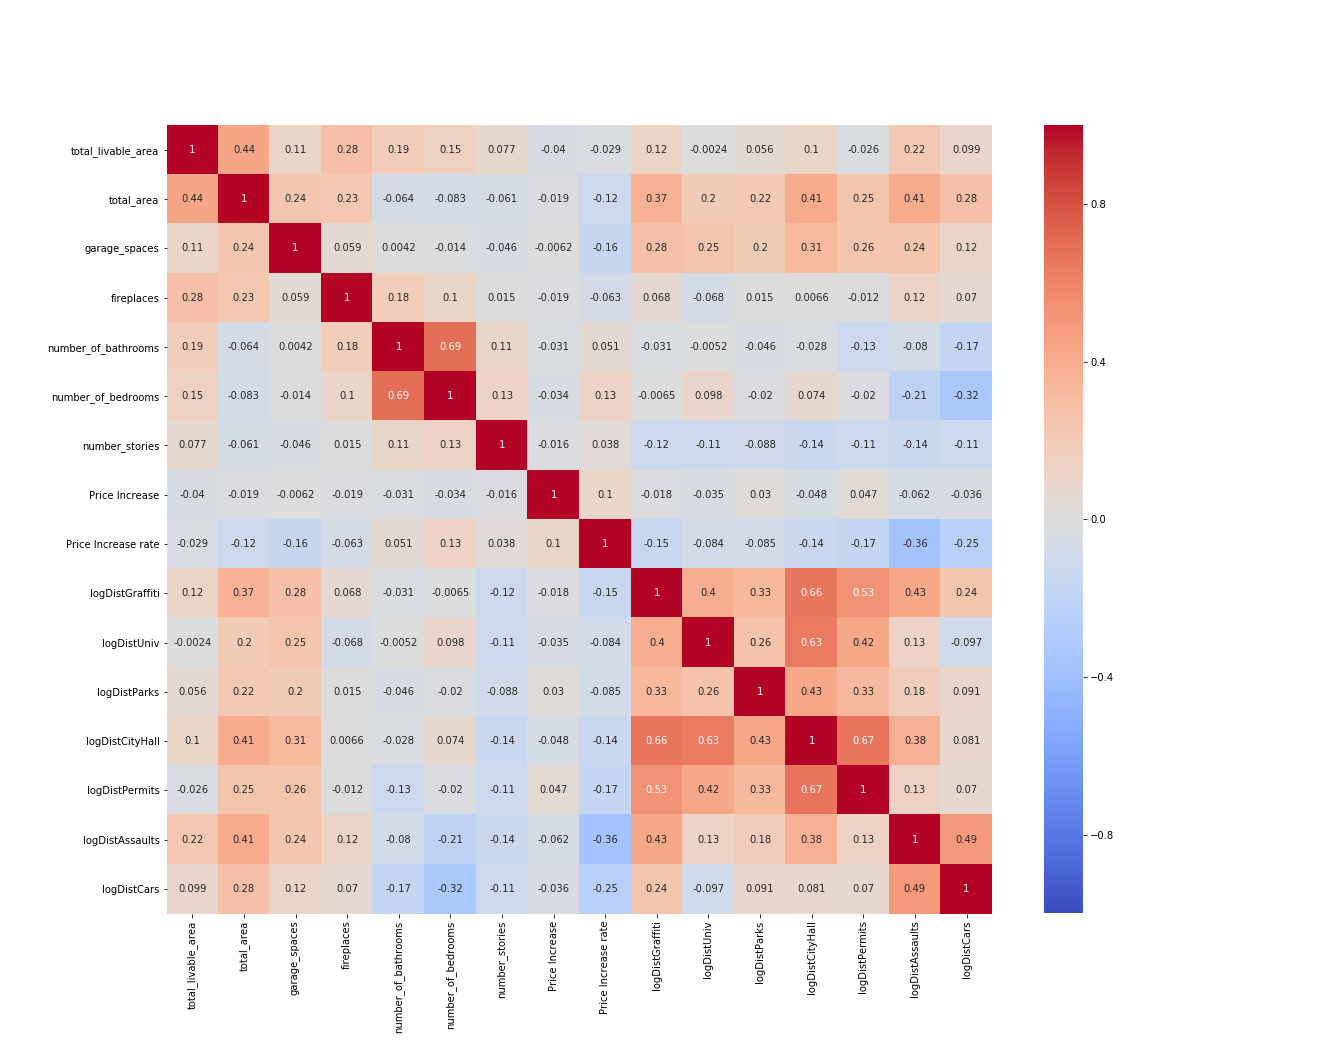
After we creating all the variables, we use correlation matrix to show the correlation between those numerical variables.
Regression
Then we make a regression by random forest to predict the House Price.
- we combine the Numerical columns and Categorical columns.
- we set up the column transformer with two transformers and scale the numerical columns and one-hot.
- we used a 70/30% training/test split and built an randomforest regression model.
- We initialize the pipeline.
- We make the grid of parameters to search
# Create the grid and use 3-fold CV
grid = GridSearchCV(pipe, param_grid, cv=3)
# Run the search
grid.fit(X_train, y_train)
Validation
First, we show the test score of our model.
#our test score
grid.score(X_test, y_test)
Testing Score = 0.8176629604411072
A testing score of 0.82 indicates that this algorithm perform well for this predicting model. This model is instructive to be used in our project.
Second, we plot a map of the median percent error by census tract. The percent error in terms of sale price or sale price per sq ft.
- We calculate the percent error of the model predictions for each sale in the test set.
- We merge the census data with our test set in a dataframe.
- We group the frame of test sales by the
GEOID10column and take the median of you percent error column. - We visualize it in the map.
Result
When we get the our model, it can be used for the prediction for the price increase rate from 2013 to 2018.
From this model, it can be seen that The predicted results are similar to the true housing price increasing rate, with higher growth rates in the city center and southwest. In our prediction, the Northeast near city center seems to have a higher growth rate than it actually is. Overall, our model performs well. Although there are some shortcomings, it can be used to predict the growth rate of house prices. It helps users understand the spatial trend of house price changes in Philadelphia.